Slide 9 of 17
Notes:
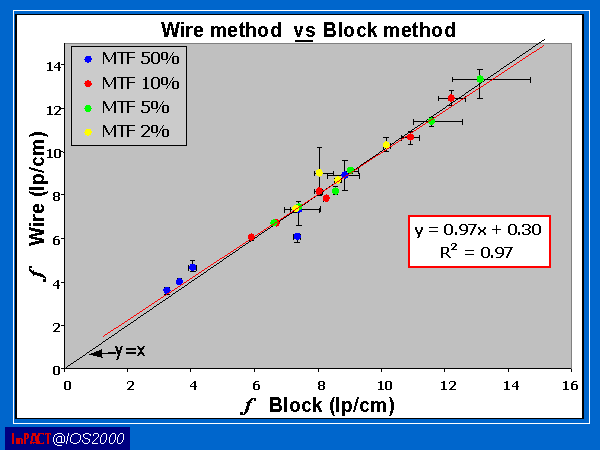
(Error bars = max. deviation from the mean)
Within a series the reconstruction algorithms run left to right, starting with the smoothest. The coloured points represent points on the MTF curve (as shown in the label).
Results clearly show a very strong correlation between the two methods, which means that we will measure the same value (within error) with either method.
There is, however, a noticeable difference between the errors in the two sets of data, and the wire method appears to have better repeatability.


