Slide 11 of 17
Notes:
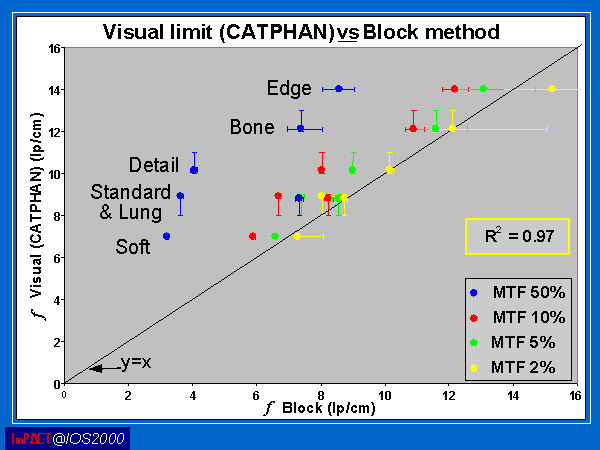
RESULTS 3: VISUAL (CATPHAN) vs BLOCK
This graph is laid out slightly differently, here the algorithms increase in sharpness from the bottom up and the points taken from the MTF curve move from left to right.
There is an obvious correlation between the 2% MTF value and the number of visible bars in the CATPHAN.
For the sharpest algorithm the 2% value is slightly further than the graph then the 5% value, but it is within experimental error of the y=x line.


