Slide 12 of 17
Notes:
RESULTS 4: QA (VISUAL) vs CATPHAN (VISUAL)
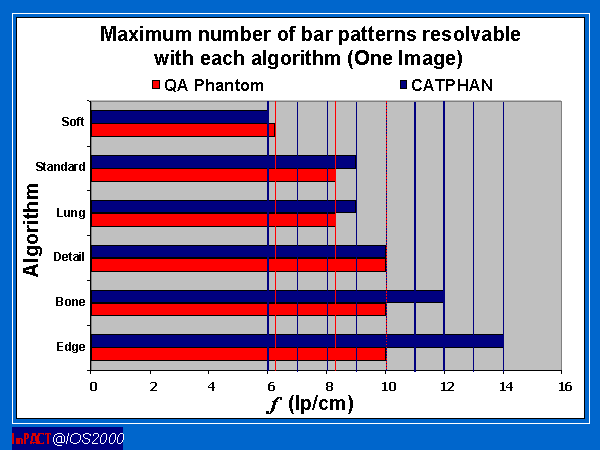
This chart shows the values measured upon visual inspection of one image, for the QA phantom and the CATPHAN.
The blue vertical lines on the graph represent the frequencies in the CATPHAN, and the red those in the QA phantom. The discrepancy between the two methods occurs because the bar patterns inside the two test objects are not at the same discrete frequencies.
At higher frequencies, the QA phantom runs out of bars and thus it is insufficient for measuring the Limiting Spatial Resolutions of, in this case, the Edge, Bone and possibly Detail algorithms.


