Slide 13 of 17
Notes:
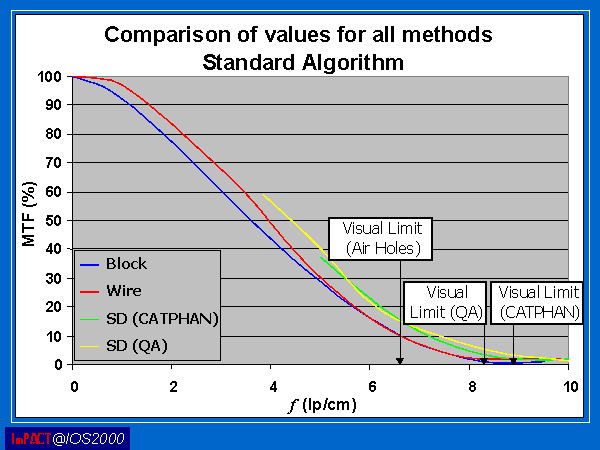
This graph is a comparison of the results produced from all methods.
The two complete MTF curves correspond to the block and wire methods and the two incomplete curves to the SD methods.
(The SD method cannot calculate the whole MTF below the cut-off frequency/3, since one must subtract a contribution from higher frequencies. These higher frequency bar patterns are not contained within both phantoms and a decision was made to use the shortened Droege method on both until a correlation was established, and then to investigate the full MTF using the CATPHAN at a later date. This work is now underway).
One can see very clearly that the visual assessments fall at ? MTF 2% value as demonstrated earlier.
The visual assessment from the air holes does not agree with the two bar patterns, but it is thought that this is because it is harder to visualise a point than a line. Work is underway to investigate this theory.


