:: dose survey summary
This article originally appeared in 'Rad' magazine, in 2000, and discusses the results of the ImPACT dose survey.
Estimating patient dose on current CT scanners: Results of the ImPACT* CT dose survey
M.A. Lewis, S. Edyvean, S.A. Sassi, H. Kiremidjian, N. Keat and A.J. Britten. ImPACT, Medical Physics, St. George's Hospital, London
Introduction
CT has for a long time been recognised as a high dose procedure and, in 1989, the NRPB undertook a wide-scale national survey to investigate the doses received from CT examinations in the UK [1]. The survey included data on 75 scanners out of approximately 200 operating in the UK at the time. The results of the survey showed that although CT comprised only 2% of all medical examinations, it contributed over 20% of the collective effective dose from these exposures [2]. Since 1989 the number of CT scanners in the UK has increased steadily, reaching a plateau of about 360 scanners in 1995. It is estimated that today, CT scans constitute 4% of all medical examinations, contributing 40% of the collective effective dose [3]. It is therefore of importance to provide information on patient dose from CT examinations, for radiation risk estimates and protocol optimisation.
Background
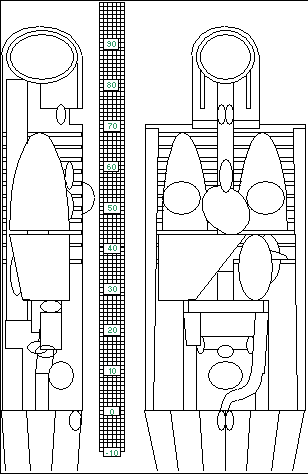
The dosimetry used in the 1989 NRPB survey was based on Monte Carlo simulations [4] of calculated x-ray spectra in an adult, hermaphrodite, mathematical phantom (Figure 1).

Figure 1. Mathematical phantom used in NRPB CT dose calculations
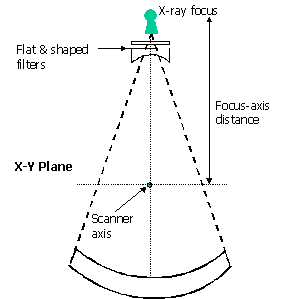
The free-in-air, on-axis dose was measured for each scanner and, with knowledge of kV, focus-to-axis distance and details of the x-ray beam filter (Figure 2), the Monte Carlo techniques modelled the dose distribution within the mathematical phantom. In total, 23 data sets were produced for all the surveyed scanner models. Doses in the data sets are obtained from the simulated, individual irradiation of 208 contiguous, 5mm thick transverse slabs, covering the mathematical phantom [5]. A data set therefore consists of 208 normalised dose values for each of the 27 organs or regions represented in the phantom.

Figure 2. Factors that can affect the dose distribution of a CT scanner
After publication of the NRPB survey data, a computer data package, CTDOSE [6], was made available. This software requires an input of scanner model, kV and scan type (head/body), to select the appropriate NRPB Monte Carlo data set. With additional information on scanning parameters, such as mAs, slice width, number of slices, scan start position and couch increment, it utilises the normalised organ dose data to provide a listing of the organ doses and effective dose for the required examination.
New Scanner Models
Currently over half the existing scanners in the UK are models not covered by the 1989 NRPB survey, therefore difficulties arise when attempting to estimate doses from this equipment. ImPACT chose to tackle this problem by determining a method of "matching" the dosimetric characteristics of the new scanner models to those scanner models covered by the NRPB data sets ("NRPB" scanners). In this way, a new scanner model can be matched to an existing NRPB Monte Carlo data set that describes its dose distribution.
ImPACT CT Dose Survey
With funding provided by the Department of Health Safety Division, a dose survey was planned with the aim of collecting data on all current CT scanners, including those in the NRPB survey. In April 1997 a round-table meeting was held at St George's Hospital to discuss and establish the survey protocol. The meeting was attended by approximately 40 physicists, representing 30 centres in the UK and Europe [3]. A protocol was subsequently finalised to measure the following parameters: x-ray beam quality (determined by half-value layer); x-ray filter shape (measurement of in-air output across the scan plane) and computed tomography dose index (CTDI on-axis, free-in-air, and at the centre and periphery of standard head and body dose phantoms). The data from the survey was centrally collated by ImPACT. Information was obtained on a total of 75 scanners from 35 centres in the UK and Europe. The results were checked for accuracy and consistency, and any anomalous data was excluded.
Method of Matching
The ImPACT survey data were used to determine which of the measured parameters was most closely related to patient dose. This was done by correlating the measurements from the NRPB scanners with the effective doses calculated using the CTDOSE software.

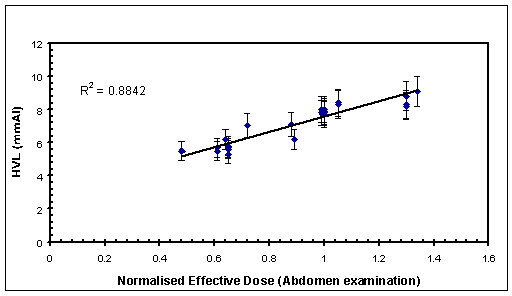
Figure 3. Correlation between x-ray beam half-value layer (HVL) and normalised effective dose for abdomen examinations
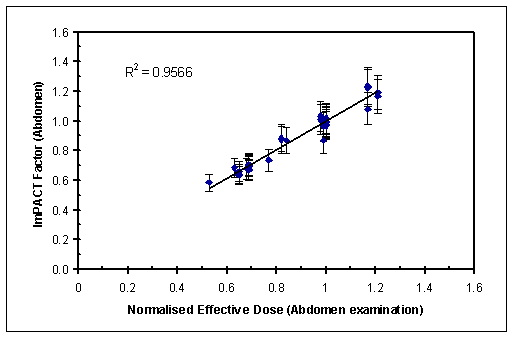
Figure 3 shows an example of the correlation between effective dose (normalised to on-axis, in-air dose) and x-ray beam half-value layer. Although a reasonable correlation is obtained with this single parameter, it was found that a better predictor of effective dose was a combination of the ratios CTDIcentre/CTDIair and CTDIperiphery/CTDIair. This value has been termed the ImPACT Factor (ImF), and its correlation with normalised effective dose, for abdomen examinations, is shown in Figure 4.

Figure 4. Correlation between ImPACT Factor and normalised effective dose for abdomen examinations
ImPACT Factors were calculated for all CT models in the ImPACT survey, and each new scanner model matched to an "NRPB" scanner by comparison of ImPACT Factors. This enabled the selection of the appropriate Monte Carlo data set for new scanner models when using the CTDOSE program (or similar software utilising the NRPB data sets). When a new CT scanner is launched, all that is required to calculate a new ImPACT Factor are the CTDI value in-air and the CTDI values at the centre and periphery of the head and body dose phantoms.
For each scanner, at each kV, the ImPACT Factor varies with examination type e.g. head, neck, chest, abdomen, pelvis. However, the variation between different head examinations or different body examinations is not significant. Therefore, in order to simplify matching, only two ImPACT Factors are calculated, one to match scanners for head examinations and the other for body examinations.
Outcome of Dose Survey
As a result of the ImPACT CT dose survey, it is now possible to estimate patient doses from CT examinations for over 90% of scanners currently installed in the UK. A sample of the scanner matchings is shown in Table 1. The full list is available on the ImPACT web-site, www.impactscan.org, and is regularly updated as CTDI data on new scanner models becomes available.
References
- Shrimpton PC, Hart D, Hillier MC, Wall BF, Faulkner K. Survey of CT Practice in the UK. Part1: Aspects of Examination Frequency and Quality Assurance, NRPB-R248. London: HMSO, 1991.
- Shrimpton PC. Protection of the Patient in X-ray Computed Tomography, Documents of the NRPB Vol.3, No.4. London HMSO, 1992.
- Shrimpton PC, Edyvean S. Commentary: CT scanner dosimetry. BJR 1998; 71: 1-3.
- Shrimpton PC, Jones DG, Hillier MC, Wall BF, Le Heron JC, Faulkner K. Survey of CT Practice in the UK. Part 2: Dosimetric Aspects, NRPB-R249. London: HMSO, 1991.
- Jones DG, Shrimpton PC. Survey of CT Practice in the UK. Part 3: Normalised Organ Doses Calculated using Monte Carlo Techniques. NRPB-R250. London: HMSO, 1991.
- Le Heron JC. CTDOSE: A User's Guide. Ministry of Health, Christchurch, New Zealand, 1993.
Acknowledgements
ImPACT would like to acknowledge the contribution of all the physicists and radiographers who contributed to the dose survey.